Chapter 18: Shiny
In this (brief) learning module, we introduce the Shiny framework for building interactive applications in R. Shiny provides a structure for communicating between a user-interface (i.e., a web-browser) and an R session. This not only enables developers to create interactive graphics, but provides a way for users to interact directly with a R session (without writing any code!).
Helpful links:
18.1 Using Multiple R Files
As projects begin to scale in size and complexity, it’s common to use multiple R scripts to perform your analysis. In the same way that we can use the library function to load R code into our session, we can use the source function to load our own R scripts. For example, imagine you have a file in which you write an R function for building a map:
# buildMap.R

BuildMap <- function(...) {
    # build a map using the data passed into this function

    # Return your map
}
You could then leverage this function in another R script by using the source function to load your file:
# analysis.R file: using other file's function, build a map

# Make sure your directory is properly set
setwd(...)

# Use the source function to load your file
source('./scripts/buildMap.R')

# Pass data to your function that you can now use
df <- read.csv('some/csv/file')
buildMap(df)
To practice breaking your code into multiple files, see exercise-1.
18.2 Shiny
Shiny is a web application framework for R. As opposed to a simple (static) web page, a web application supports more sophisticated interactions, and often connects multiple programming environments (i.e., passing information between multiple machines).
18.2.1 Application Architecture
In order to use Shiny, you’ll need to have a strong understanding of how a Shiny App is organized. This article outlines it pretty clearly. In short, you’ll have two scripts: one to describe the user interface (ui.R), and another to describe the code to execute in R (server.R).
18.2.2 User Interface (ui.R)
The user interface of your application (i.e., how your app will be displayed to your user in a web browser) is described by your ui.R file. Similarly to using RMarkdown, it can render R content such as text or graphics. However, it also allows you to create widgets, which are interactive controls that affect your application. Here is a simple example of writing out a user-interface (for more widgets, see here):
# From http://shiny.rstudio.com/articles/basics.html
library(shiny)

# Define UI for application that draws a histogram
shinyUI(fluidPage(

  # Application title
  titlePanel("Hello Shiny!"),

  # Sidebar with a slider input for the number of bins
  sidebarLayout(
    sidebarPanel(
      sliderInput("bins",
                  "Number of bins:",
                  min = 1,
                  max = 50,
                  value = 30)
    ),

    # Show a plot of the generated distribution
    mainPanel(
      plotOutput("distPlot")
    )
  )
))
The above code defines a user-interface’s layout using panels, or sections of a page. The segment above would render this UI:
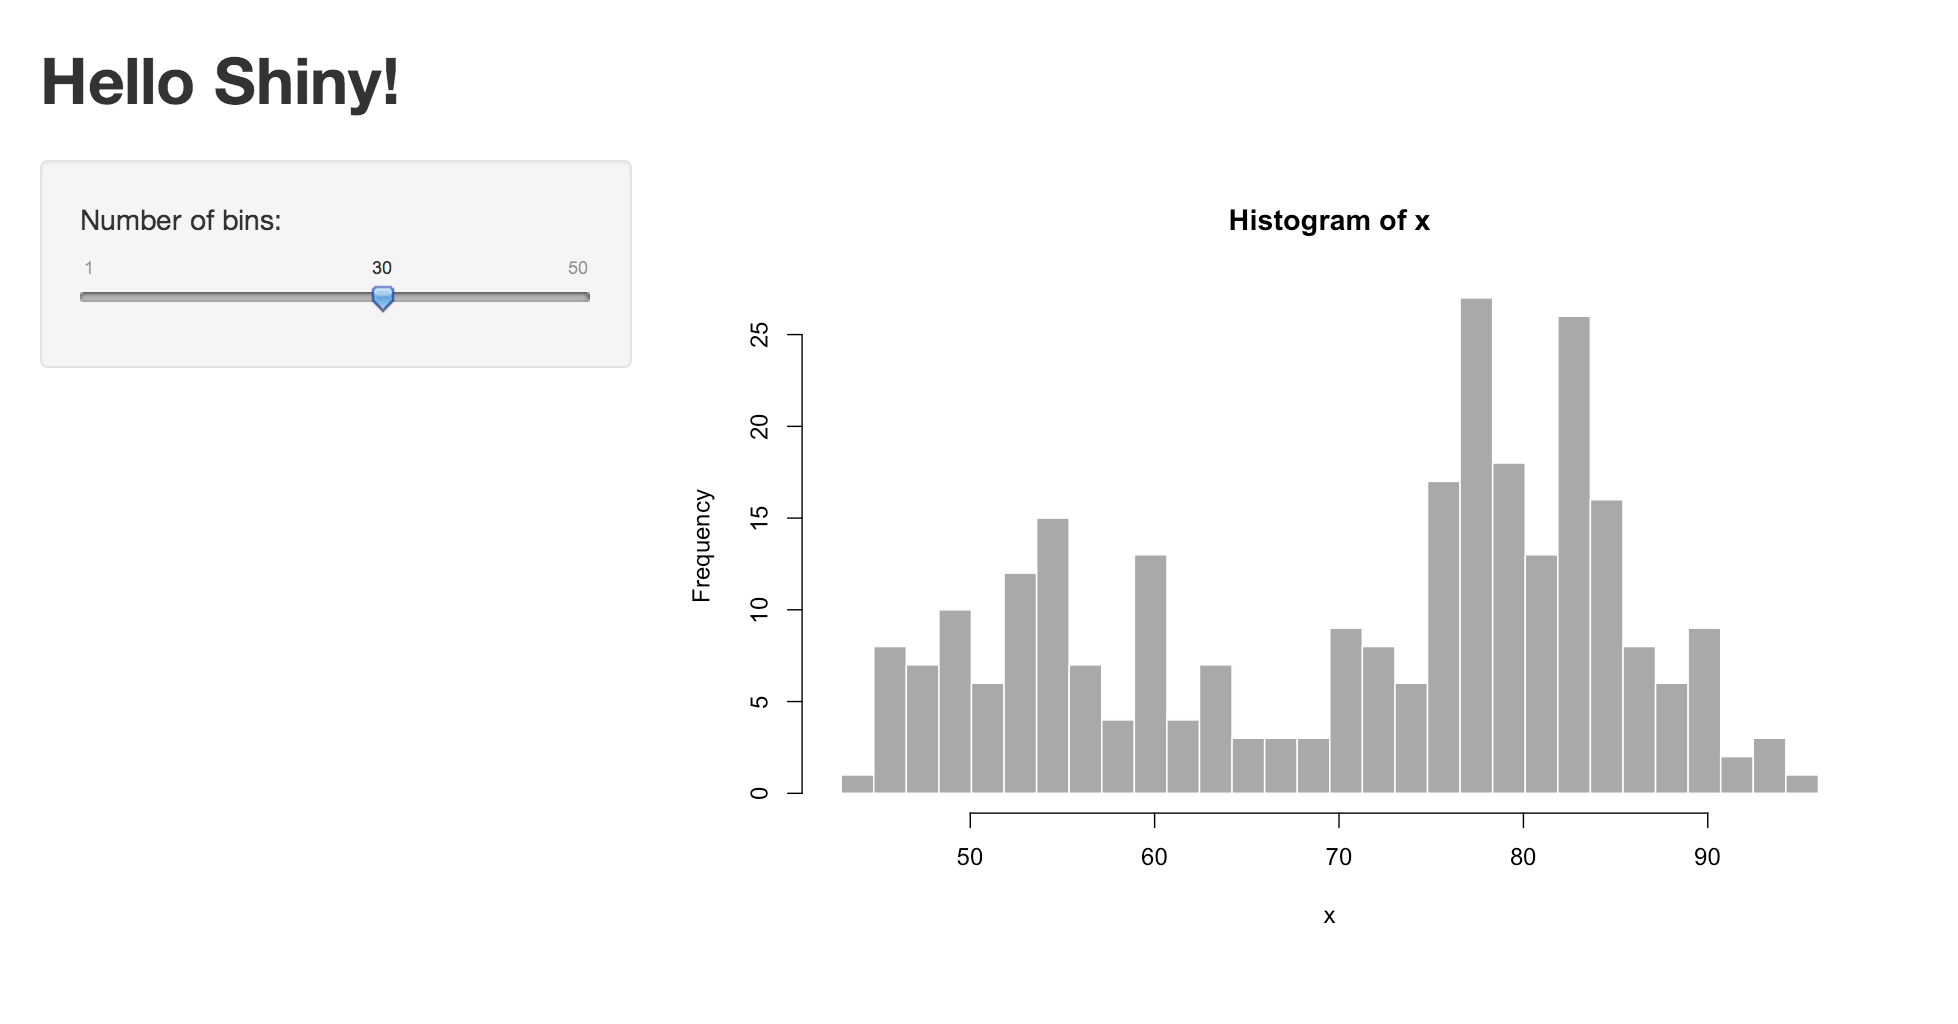
histogram made by shiny
If you dissect the code, you can start to see how each element is rendered in the UI. However, it doesn’t make clear where the element "distPlot" is coming from. That’s the other half of our project, in server.R.
18.2.3 Server code (server.r)
Your user interface (ui.R) is populated with information from an R session (which we’ll think of as the server for our application). The Shiny architecture allows you to pass information back and forth between the user-interface and the server. Here is the corresponding server.R code for the UI above:
# From: http://shiny.rstudio.com/articles/basics.html
library(shiny)

# Define server logic required to draw a histogram
shinyServer(function(input, output) {

  # Expression that generates a histogram. The expression is
  # wrapped in a call to renderPlot to indicate that:
  #
  #  1) It is "reactive" and therefore should be automatically
  #     re-executed when inputs change
  #  2) Its output type is a plot

  output$distPlot <- renderPlot({
    x    <- faithful[, 2]  # Old Faithful Geyser data
    bins <- seq(min(x), max(x), length.out = input$bins + 1)

    # draw the histogram with the specified number of bins
    hist(x, breaks = bins, col = 'darkgray', border = 'white')
  })

})
Note, the distPlot is stored as part of the server’s output (output$distPlot). It is then accessible in the UI, and can be rendered using the plotOutput function.
Similarly, you should note that the UI has a sliderInput called bins. We can then reference the UI information in our server.R file by saying input$bins (i.e., bins is stored as part of the input that the server receives).
To actually run your Shiny app, click on the Run App button in R Studio:
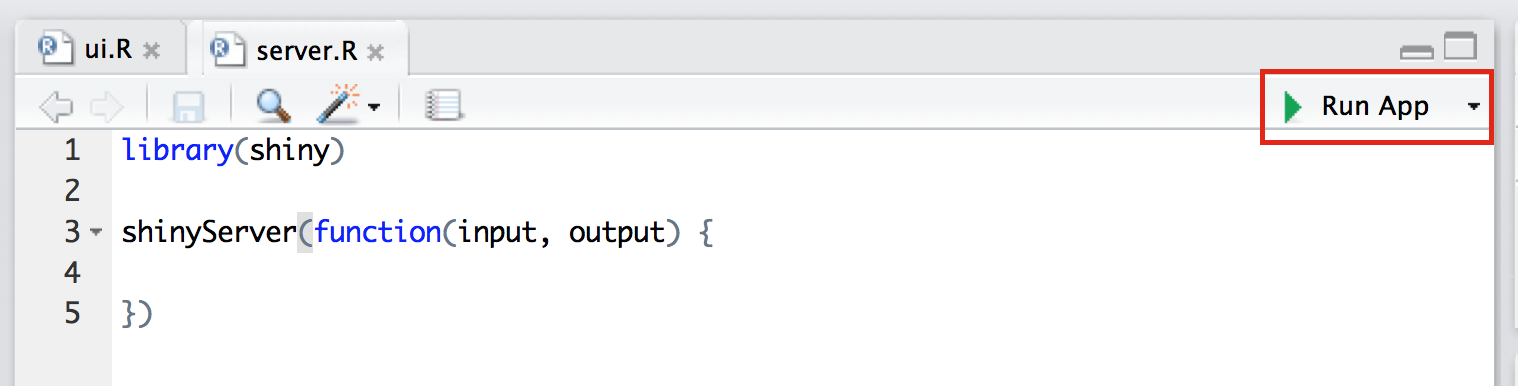
run shiny application button
To see these scripts in action, see demo-1, or practice with exercise-2.
18.3 Publishing ShinyApps
Sharing a ShinyApp with the world is a bit more involved than simply pushing your code to GitHub(though still quite painless). We can just use GitHub because, in addition to needed a web host, we need a session of R running that the UI can connect to. In this class, we’ll introduce shinyapps.io.
You’ll need to create an account on shinyapps.io, then you can publish your apps using the publish button:
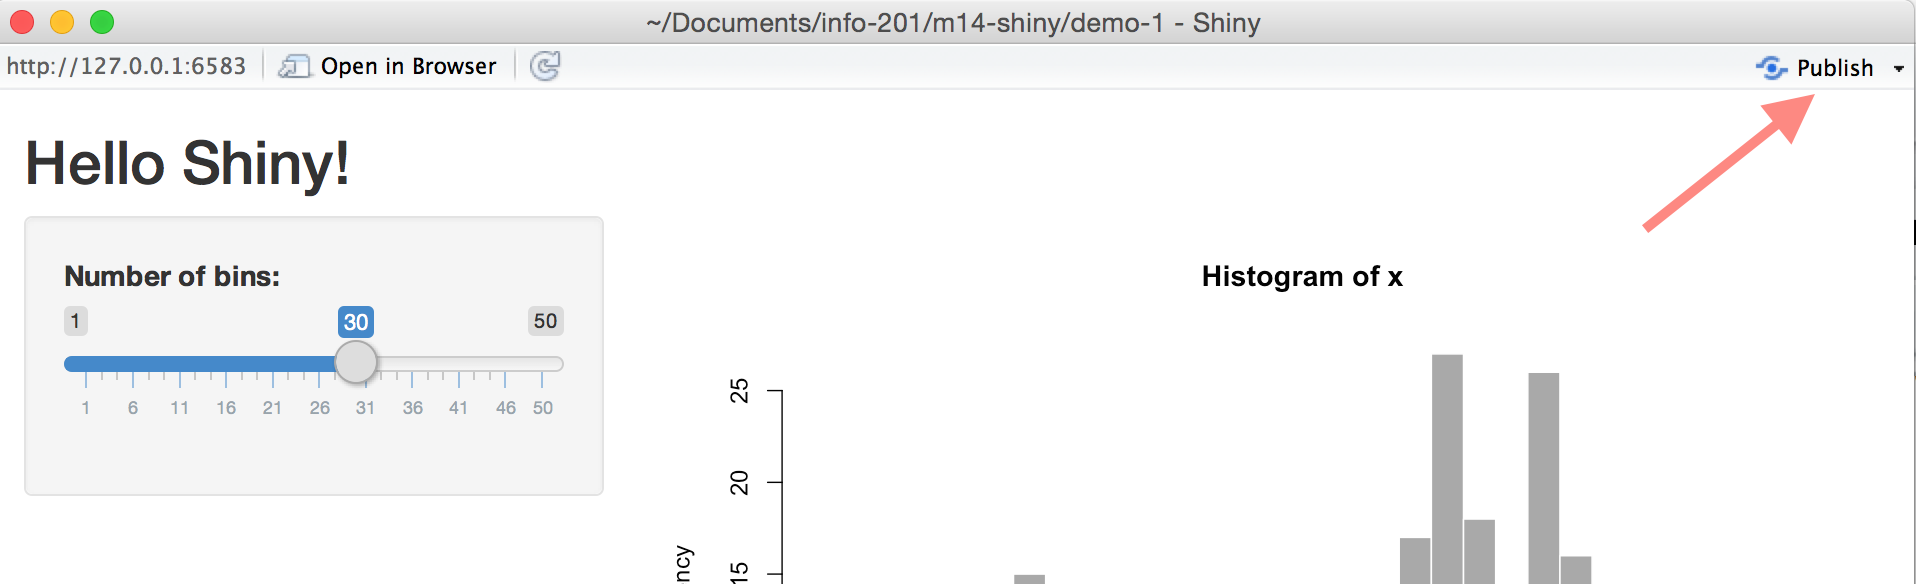
shiny publish button
You should then be able to access your app at https://USERNAME.shinyapps.io/PROJECT-NAME/. For more information and troubleshooting, see the documentation.